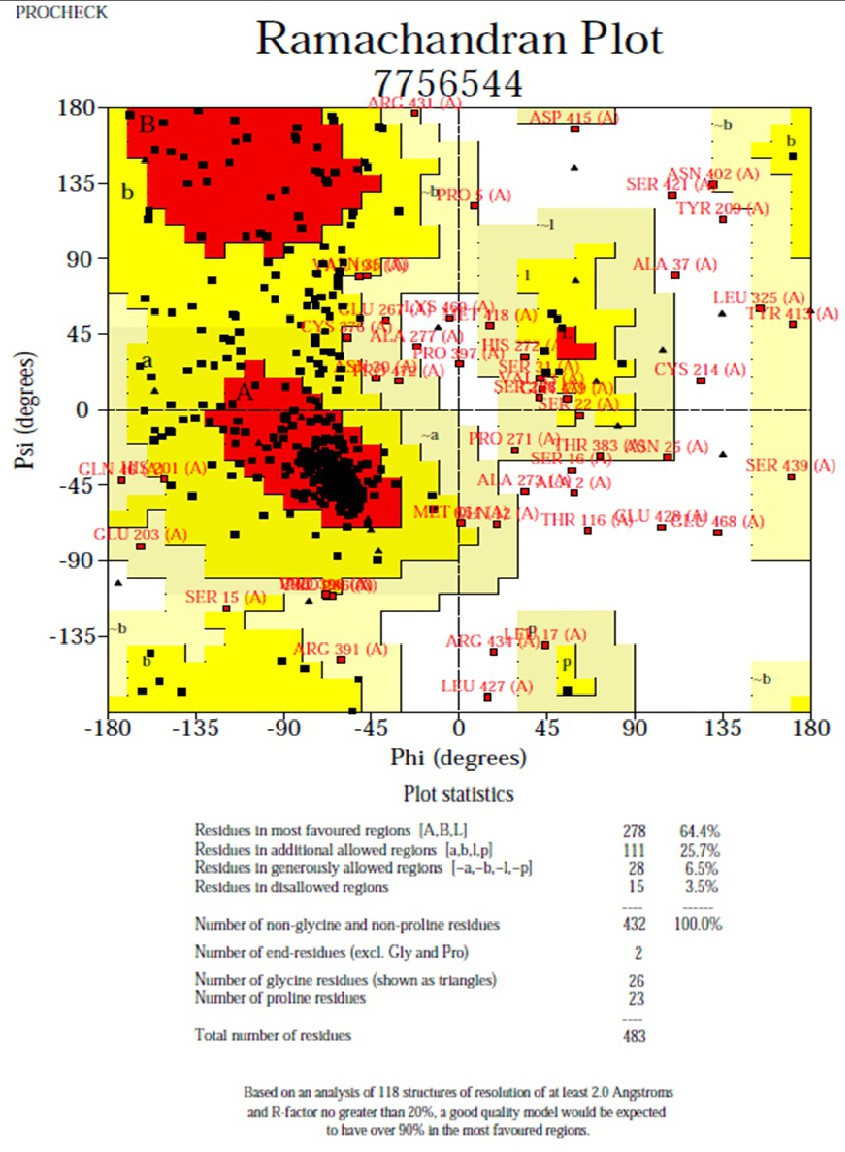
Fig. 6. Ramachandran plot (PROCHECK) for GnIHR2 protein showing the dihedral angles Psi and Phi of amino acid residues. The residues which lie in most favored regions (A, B, L) are shown in red curves, and the residues which lie in additional allowed regions (a, b, l, p) are in dark yellow curves.